|
Evaluation of a local questionnaire
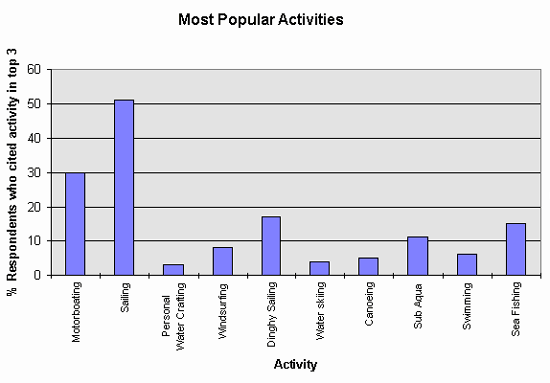
Most Popular Activities
Perception of recreational levels
in mSAC sites
Area specific comments from local
respondents in mSAC areas
Local respondents were asked to identify recreational
activities, which they had seen occurring in their local area.
Respondents were given a list and asked to tick relevant activities.
This was to provide a very approximate indication of the perceived
scale of activities in site areas. The following table illustrates
the findings of this activity review.knowledge for participation.
Activities observed in demonstration sites
|
Activity
|
Site
|
Total
|
| |
1
|
2
|
3
|
4
|
5
|
6
|
7
|
8
|
9
|
10
|
11
|
12
|
|
|
Motorboating
|
12
|
8
|
17
|
12
|
0
|
5
|
2
|
1
|
3
|
8
|
10
|
5
|
86
|
|
Sailing
|
13
|
8
|
17
|
13
|
1
|
5
|
2
|
1
|
3
|
8
|
10
|
5
|
60
|
|
Personal watercrafting
|
8
|
6
|
14
|
8
|
0
|
4
|
0
|
0
|
1
|
4
|
10
|
5
|
75
|
|
Dinghy sailing
|
13
|
9
|
14
|
12
|
0
|
5
|
2
|
1
|
2
|
8
|
10
|
5
|
81
|
|
Water skiing
|
9
|
6
|
12
|
10
|
0
|
4
|
1
|
0
|
1
|
7
|
10
|
5
|
65
|
|
Canoeing
|
13
|
8
|
11
|
12
|
0
|
2
|
1
|
1
|
3
|
8
|
10
|
5
|
74
|
|
Sub aqua
|
9
|
6
|
4
|
11
|
0
|
3
|
2
|
1
|
3
|
8
|
9
|
3
|
59
|
|
Swimming
|
9
|
8
|
14
|
7
|
1
|
4
|
1
|
1
|
1
|
7
|
10
|
4
|
67
|
|
Snorkelling
|
8
|
4
|
3
|
5
|
0
|
0
|
1
|
1
|
0
|
2
|
8
|
3
|
35
|
|
Sea fishing
|
10
|
9
|
13
|
10
|
0
|
5
|
2
|
1
|
1
|
7
|
10
|
4
|
72
|
|
Motor-towed inflatables
|
4
|
5
|
7
|
3
|
0
|
2
|
0
|
0
|
0
|
2
|
7
|
3
|
33
|
|
Surfing
|
3
|
3
|
5
|
7
|
0
|
1
|
0
|
0
|
0
|
0
|
6
|
5
|
30
|
|
Bird watching
|
10
|
6
|
17
|
13
|
2
|
3
|
2
|
1
|
2
|
8
|
8
|
4
|
76
|
|
Day tripping
|
8
|
8
|
16
|
12
|
2
|
4
|
1
|
1
|
3
|
4
|
10
|
4
|
73
|
|
Walking/hiking
|
10
|
9
|
17
|
13
|
2
|
4
|
1
|
1
|
3
|
8
|
10
|
4
|
82
|
|
Dog walking
|
11
|
8
|
17
|
13
|
2
|
5
|
1
|
1
|
2
|
7
|
9
|
4
|
80
|
|
Fossil collecting
|
1
|
3
|
3
|
4
|
0
|
0
|
0
|
0
|
0
|
1
|
2
|
1
|
15
|
|
Horse riding
|
9
|
5
|
14
|
10
|
2
|
4
|
0
|
0
|
2
|
6
|
7
|
3
|
62
|
|
Cycling
|
11
|
6
|
12
|
11
|
2
|
2
|
0
|
1
|
3
|
8
|
8
|
3
|
67
|
|
Off roading
|
1
|
2
|
6
|
1
|
1
|
2
|
0
|
0
|
1
|
0
|
3
|
1
|
18
|
|
Land yachting
|
1
|
0
|
5
|
3
|
0
|
2
|
0
|
0
|
0
|
0
|
4
|
2
|
17
|
|
Kite flying
|
7
|
14
|
13
|
5
|
2
|
4
|
0
|
0
|
1
|
0
|
9
|
4
|
49
|
|
Shoreline angling
|
13
|
8
|
12
|
12
|
1
|
4
|
2
|
1
|
1
|
4
|
10
|
4
|
72
|
|
Jogging
|
9
|
4
|
12
|
7
|
2
|
3
|
0
|
0
|
2
|
6
|
7
|
4
|
56
|
|
Sand sculpting
|
3
|
0
|
1
|
2
|
0
|
0
|
0
|
0
|
0
|
0
|
1
|
2
|
9
|
|
Total
|
15
|
9
|
17
|
14
|
2
|
6
|
2
|
1
|
3
|
8
|
10
|
5
|
92
|
1. Plymouth Sound and Estuaries, England
2. Chesil and the Fleet, England
3. The Wash and North Norfolk Coast, England
4. Berwickshire and North Northumberland Coast, England &
Scotland
5. Morecambe Bay, England
6. Solway Firth, England & Scotland
7. Papa Stour, Scotland
8. Loch Maddy, Scotland
9. Sound of Arisaig, Scotland
10. Strangford Lough, N. Ireland
11. Llyn Peninsula, Wales
12. Cardigan Bay, Wales
The table above illustrates that a number of
activities are commonly observed in mSAC areas including:
- motorboating
- dinghy sailing
- walking/hiking
- dog walking
A number of other activities were also observed
by respondents including:
- samphire gathering (Norfolk)
- caravaning (South Coast)
- gig rowing (Plymouth Sound)
- golf (Northumberland)
- flying (Strangford Lough)
- camping (Llyn Peninsula)
- wildfowling (various sites)
These figures confirm that a huge variety of
recreational activities occur in and around mSAC sites.
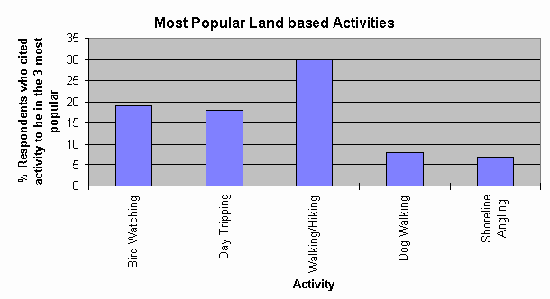
Most Popular Activities
Respondents were questioned as to what they
considered the most popular local activities to be and their
perceptions as to the levels of these activities (see questions
2.3-2.5). Respondents were asked to suggest which were the three
most common recreational activities that occurred within their
local mSAC demonstration site area. The results for water-based
and land-based activities are shown in the following diagrams.
It should be noted that the following figures apply only to
the situation within the demonstration site areas. However,
the demonstration sites offer a great variety of recreational
examples, in terms of the level and types of activity at each
site, and are therefore a good indication of the possible recreational
activities at other mSAC sites.
It should also be noted that surveys of this
nature are largely subjective. However, perceptions of levels
of recreation can be an important factor in understanding the
extent of support for particular management methods and therefore
the results of the survey are of general interest.

The Most Common Water-based Activities
- The responses from the questionnaires suggest that the following
are the most commonly occurring water-based activities in
the demonstration areas:
- motorboating
- sailing
- dinghy sailing
- sub aqua
- sea fishing
The Most Common Land-based Activities

The responses from the questionnaires suggest
that the most common shore-based activities are:
- bird watching
- day tripping
- walking/hiking
- dog walking
- shoreline angling
Local respondents were also questioned as to
whether they believed the levels of recreation occurring in
their local area to be low, just right or overcrowded. The findings
below may be skewed due to individual perceptions of recreation.
Perception of recreational
levels in mSAC sites
|
Activity
|
Overcrowded
|
Level about right
|
Low participation
|
|
Motorboating
|
1
|
29
|
2
|
|
Sailing
|
3
|
49
|
3
|
|
Personal watercrafting
|
1
|
4
|
1
|
|
Windsurfing
|
|
9
|
|
|
Dinghy Sailing
|
1
|
12
|
|
|
Water-skiing
|
|
5
|
|
|
Canoeing
|
|
3
|
2
|
|
Sub-Aqua
|
7
|
4
|
1
|
|
Swimming
|
|
6
|
|
|
Snorkelling
|
|
|
|
|
Sea fishing
|
|
15
|
2
|
|
Motor towed inflatables
|
|
|
|
|
Surfing
|
|
1
|
|
|
Bird watching
|
1
|
20
|
|
|
Day tripping
|
12
|
7
|
1
|
|
Walking/hiking
|
2
|
26
|
2
|
|
Dog walking
|
|
8
|
|
|
Fossil hunting
|
|
|
|
|
Horse riding
|
|
|
|
|
Cycling
|
|
1
|
|
|
Off roading
|
|
|
|
|
Land yachting
|
|
|
|
|
Kite flying
|
|
|
|
|
Shoreline angling
|
1
|
7
|
|
|
Jogging
|
|
|
|
|
Sand sculpting
|
|
|
|
The table above suggests that the majority
of respondents feel that levels of activity in mSAC areas are
about right. Respondents were also asked to provide an estimation
of the actual number of people who take part in specific recreational
activities in each mSAC site. However, most respondents did
not respond to this question.
Area specific comments from
local respondents in mSAC areas
Local respondents were given the opportunity
to comment on management measures and generally on the development
of the study (see questions 3.3-3.5). Appendix 6 briefly reviews
these comments.
|

