Nutrient load analysis and modelling
Background and Methodology
Results
Background and Methodology
Nutrient load analysis and simple modelling of
the Fleet lagoon was carried out by Environment
Agency using data obtained during water quality
monitoring studies from 1996 to >98
(Murdoch 1999) and information from Mainstone and
Parr 1999. The relative contributions of point sources
(sewage works discharges), freshwater and wildfowl
contributions to the nitrogen and phosphate concentration
levels in the lagoon was quantitatively assessed.
The modelling attempted to assess input loads on
daily and seasonal as well as annual timescales.
Before the modelling was carried out, nutrient
sources were identified and their loads estimated.
Two direct discharges from Wessex Water plc. sewage
treatment works (STW) at Abbotsbury and Langton
Herring discharge into streams entering the Fleet
(Mill stream (Horsepool) and Rodden Stream respectively).
Other smaller sewage effluent discharges were not
included in the model as they are very small, and
their input is not thought to be significant in
overall terms (Mainstone & Parr 1999).
No continuous flow monitoring data were available
for the streams, therefore flows were estimated
from mean flow statistics using the Institute of
Hydrology=s Micro Low Flow methodology. Estimated daily
stream flows are then calculated using flow data
from the nearby Broadwey gauging station to estimate
daily variations. Calculated flows were compared
to spot gaugings of stream flows, with relatively
good agreement between the two for all streams except
Mill Stream (Horsepool) and Mill Stream (Abbey Barn).
Flows for Mill Stream (Horsepool) were adjusted
in the light of this comparison as it receives effluent
from Abbotsbury STW which would not have been taken
account of in the flow estimations. Nutrient monitoring
data were available for six of the seven streams
(inputs from Herbury stream were assumed to be similar
to those of the nearby East Fleet stream).
Diffuse input flows (run-off from land into the
lagoon directly) were estimated using Micro Low
Flow methodology, and were assumed to be evenly
distributed between Abbotsbury and East Fleet. Nitrogen
concentration of diffuse sources was assumed to
be 5 mg/l N, estimated from the concentration
of nitrogen found in borehole water nearby. No data
were available for phosphorus content of borehole
water, and since phosphorus mobility is low, diffuse
inputs of phosphorus were ignored for the purpose
of this modelling.
Estimated inputs from faecal matter of wildfowl,
including swans, were put into the model using estimates
based on monthly numbers of birds and the nitrogen
and phosphorus content of faeces (Mainstone &
Parr 1999). For the purposes of the modelling, the
worst case of all wildfowl faeces input to the lagoon
was assumed (rather than one third defaecated into
the lagoon with two thirds onto land as estimated
in Mainstone & Parr 1999).
The model (ECoS (2)) was used to obtain simulations
of annual budgets. Use of this model means that
short term accuracy is traded for the ability to
do long simulations. Physical and tidal data required
by the model were taken from Robinson=s work (Robinson 1983; Robinson et al
1983). This model is much more approximate than
that developed by Westwater, Falconer and Lin (1999),
because of the level of accuracy of the bathymetry,
tidal and flow data used, and the fact that it is
a one dimensional model rather than two dimensional.
Results
Nitrogen:
For total inorganic nitrogen (TIN), the freshwater
streams were found to dominate inputs to the system.
Stream inputs showed a strong annual cycle with
winter highs and summer lows. The inference is that
winter runoff and flushing of nitrates is responsible
for the winter peaks observed. Annual loads for
three of the streams (Abbey Barn, Rodden and West
Fleet) were around 20-25 tonnes N per year, with
the other streams (Horsepool, Herbury and East Fleet)
around 15 tonnes N per year and Cowards Lake lowest
at 7 tonnes N per year. The loads for Mill stream
(Abbey Barn) and for Rodden stream include the inputs
from Abbotsbury and Langton STWs respectively, although
both are shown separately in addition on the graph
below. Abbotsbury sewage treatment works (STW) output
and wildfowl had very low loadings (2 tonnes N per
year). Input from Langton STW was negligible. Total
inorganic nitrogen (TIN) loads were greatest at
the Abbotsbury (western) end of the Fleet.
Annual nitrogen loads to the Fleet (from Murdoch
1999)
Phosphorus:
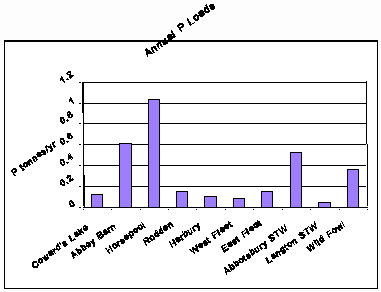
The model showed a double annual cycle in phosphorus
loads, with winter highs and summer highs. The winter
highs appeared related to the stream inputs (particularly
Mill stream (Horsepool) and Mill stream (Abbey Barn),
but also Cowards Lake, Rodden stream and West Fleet
stream). The stream loads from Mill stream (Horsepool)
and Mill stream (Abbey Barn) are highest at about
8 kg/day in winter. Mill stream (Horsepool)
load includes the effluent from Abbotsbury STW (which
contributes approximately 2 kg/day). Other
stream inputs were much lower with winter inputs
of less than 2 kg/day. The summer highs appear
to be related to the wildfowl inputs; the impact
of wildfowl may be exacerbated owing to associated
high organic loadings resulting in increased anoxia
within sediments and enhanced phosphate release
(Mainstone pers. comm.). However, there could be
effects from Abbotsbury STW inputs entering the
western Fleet and not being flushed out to the eastern
Fleet and the sea.
Annual phosphorus loads to the Fleet (from Murdoch
1999)

Next Section
References
|